Still Relying on Restart Magic for Troubleshooting? Master Cloud-Native Monitoring with LGTM Stack
3/11/2026
In today’s world where distributed microservice architectures have become mainstream, system complexity is growing exponentially. When online issues occur, are you still relying on “restart magic” and “log digging” to locate problems? When your service count grows from 10 to 100, are you still using traditional monitoring methods? It’s time to build a modern observability framework.
I. Monitoring Challenges and Solutions in the Cloud-Native Era
1.1 Limitations of Traditional Monitoring
Remember the monolithic application era? One application, one database, one log file—when something went wrong, you could locate the issue just by checking the logs. But what about now?
Real-world scenario:
- User reports “device list loading is slow”
- You check Gateway Service logs → Normal
- You check Device Service logs → A bit slow but not obvious
- You check database logs → Connection pool normal
- You check Redis logs → No problem either
- Finally discovered: Kafka consumer lag caused Data Service slow response, affecting the entire call chain
This is the black box dilemma of distributed systems: a single request may span 5-10 services, and traditional monitoring methods simply cannot track the complete call chain.
1.2 What is Observability?
Observability refers to the ability to infer a system’s internal state through its external outputs. Unlike traditional monitoring, observability emphasizes proactive issue detection and rapid root cause localization.
Observability is built on three pillars:
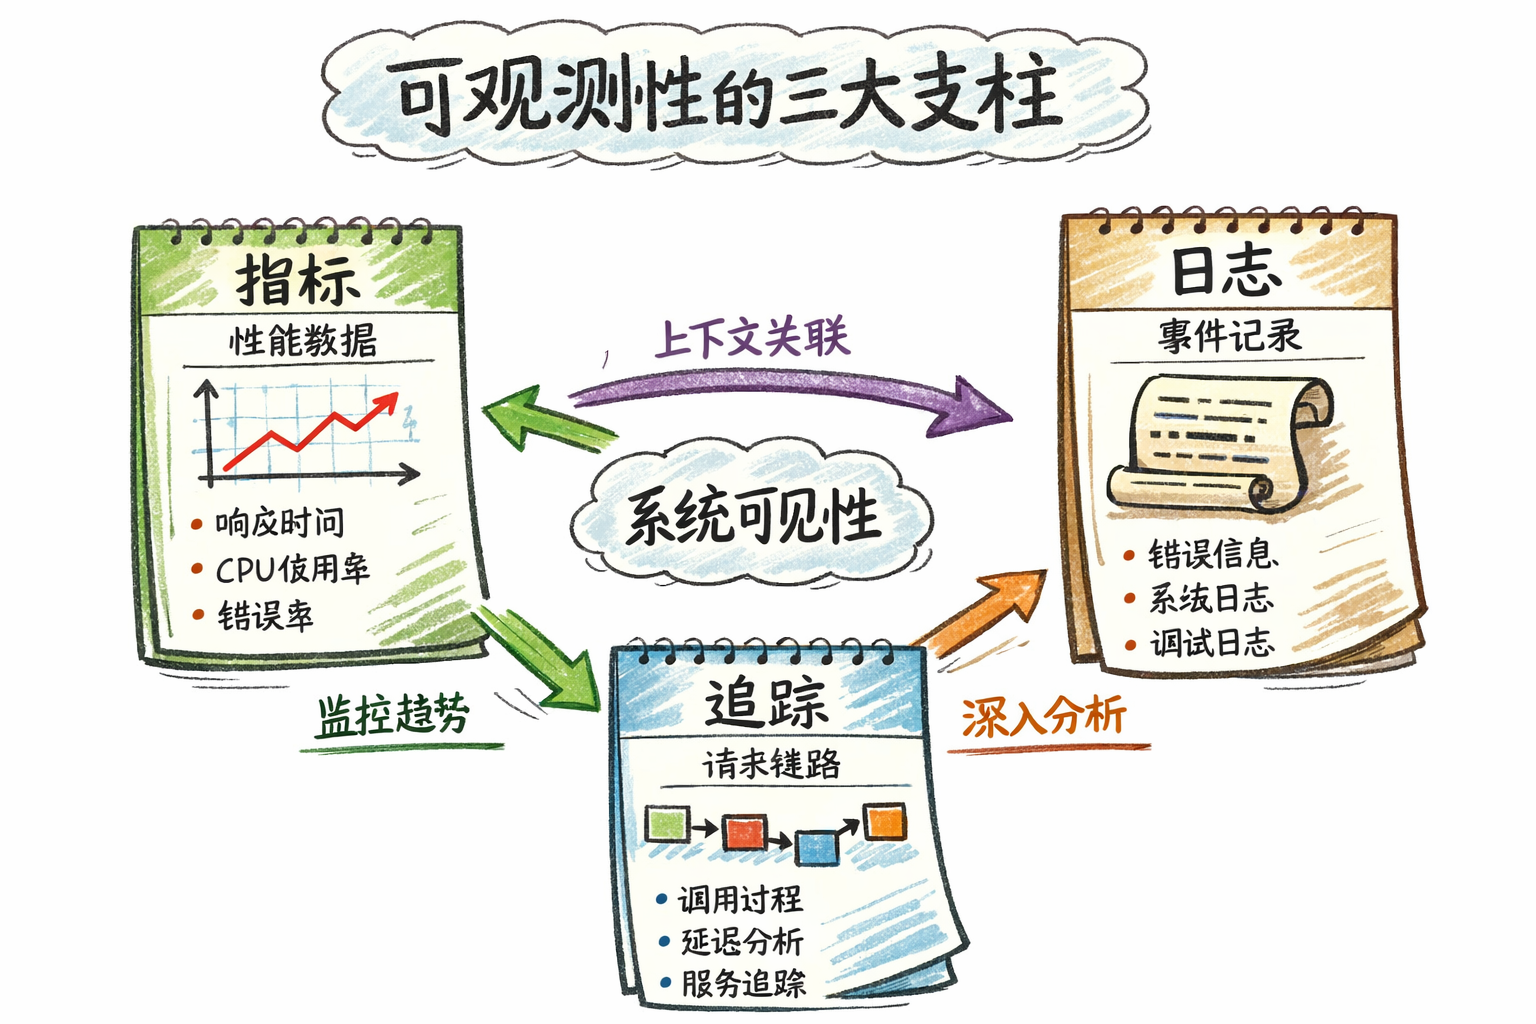
| Pillar | Purpose | Problem Solved | Typical Tools |
|---|---|---|---|
| Metrics | Overall view of system status | ”How is the system doing now?” | Prometheus + Grafana |
| Logs | Detailed event records | ”What exactly happened?” | Loki / ELK |
| Traces | Complete call chain of requests | ”Which services did the request go through? Where was time spent?” | Tempo / Jaeger / SkyWalking |
How do the three pillars work together?
- Metrics discover issues: Dashboard reveals “device list API P95 latency spiked to 5 seconds”
- Traces locate bottlenecks: Distributed tracing reveals “80% time spent on database query”
- Logs show details: Logs reveal “database connection pool wait alert, connections exhausted”
II. LGTM Stack: The De Facto Standard for Cloud-Native Monitoring
2.1 What is LGTM Stack?
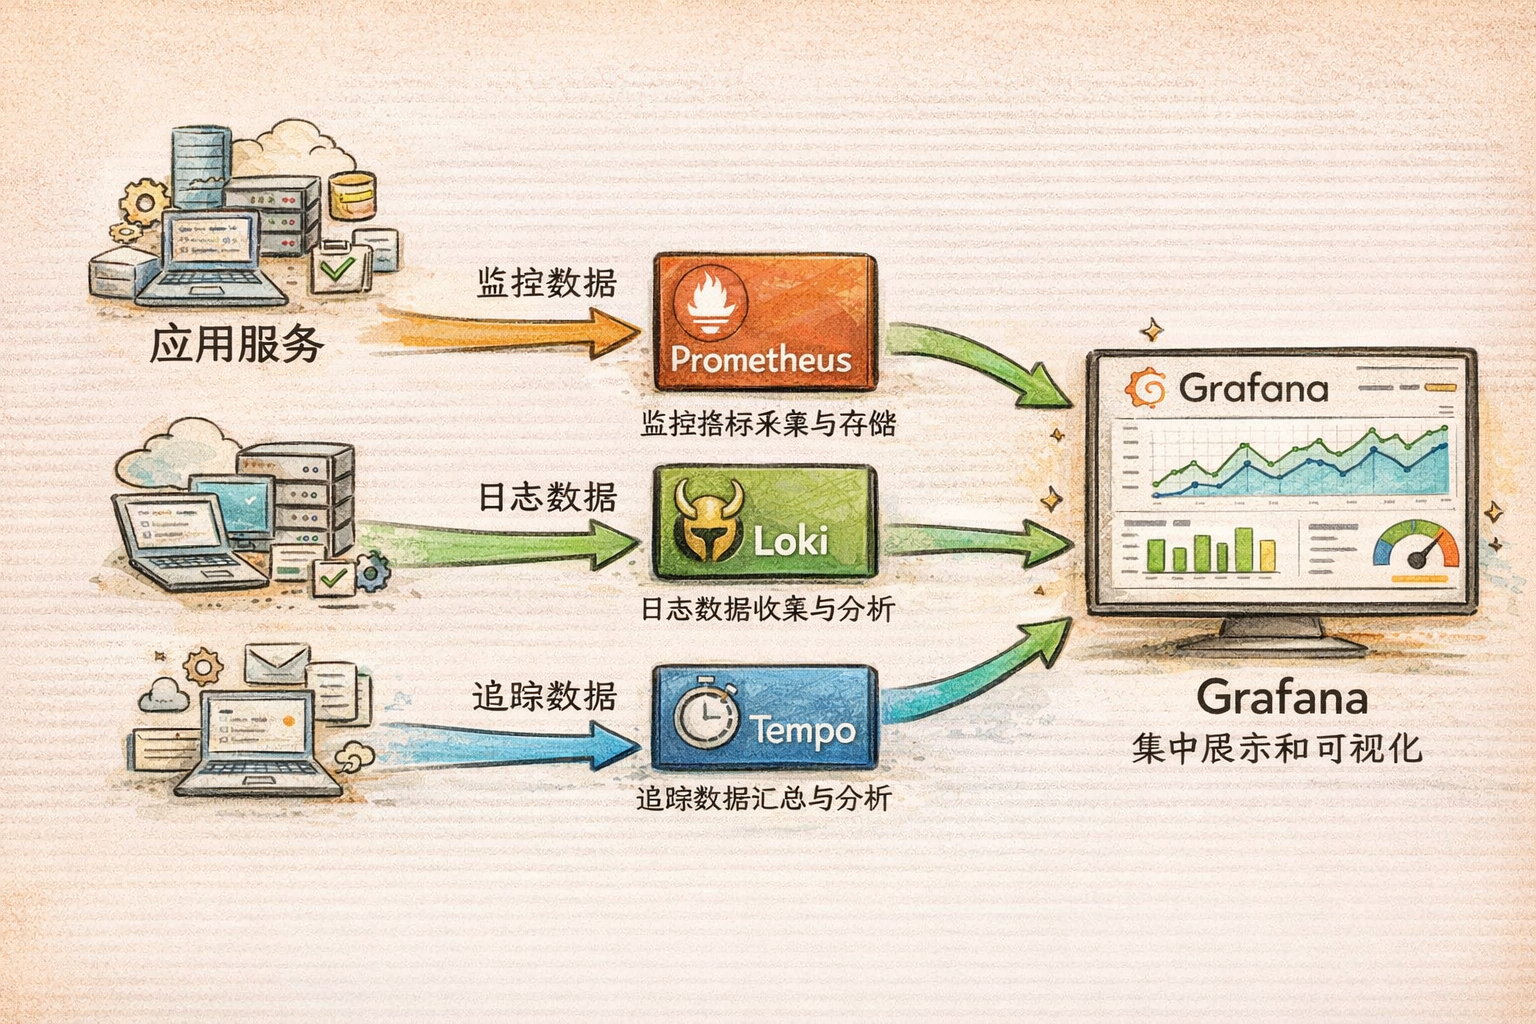
LGTM Stack is currently the most popular open-source observability solution, composed of four core components:
- Loki - Log aggregation system
- Grafana - Unified visualization platform
- Tempo - Distributed tracing
- Prometheus(M) - Metric collection and storage
Note: Although the acronym is LGTM, components are typically learned and used in the order: Prometheus → Loki → Tempo → Grafana.
2.2 Why Choose LGTM Stack?
| Aspect | LGTM Stack | Traditional Solutions (e.g., ELK + Zipkin) |
|---|---|---|
| Cost | Low (resource consumption only 10-20% of ELK) | High |
| Deployment Complexity | Low (cloud-native design) | High |
| Learning Curve | Gentle (unified query style) | Steep (multiple query languages) |
| Integration | High (Grafana unified visualization) | Low (multiple independent systems) |
| Use Cases | Cloud-native, Kubernetes, microservices | Traditional architectures |
III. Deep Dive into LGTM Components
3.1 Prometheus: Metric Collection and Storage
Core Function
Prometheus is an open-source system monitoring and alerting tool, primarily responsible for collecting, storing, and querying time-series metric data.
How It Works
┌─────────────────┐
│   Application   │ Exposes /metrics endpoint
│  (Spring Boot)  │
└────────┬────────┘
         │
         ▼ Pull mode (every 15 seconds)
┌─────────────────┐
│   Prometheus    │ Collects and stores metrics
└────────┬────────┘
         │
         ▼ PromQL query
┌─────────────────┐
│     Grafana     │ Visualization
└─────────────────┘
Key Features
- Pull-based collection: Prometheus actively pulls metrics from target services (default 15 seconds)
- Multi-dimensional data model: Flexible querying through labels
# Example: Query request rate grouped by service and status code http_requests_total{method="GET", status="200"} - PromQL query language: Powerful time-series data querying capability
- Alert management: Rule-based alerting and notification
Four Metric Types
| Metric Type | Characteristics | Use Cases | Example |
|---|---|---|---|
| Counter | Monotonically increasing | Cumulative values (total requests, total errors) | http_requests_total |
| Gauge | Can go up or down | Instantaneous values (current memory, current connections) | memory_usage_bytes |
| Histogram | Distribution statistics | Latency distribution, request size distribution | http_request_duration_seconds |
| Summary | Quantile statistics | Pre-calculated quantiles | request_duration_seconds{quantile="0.95"} |
Common PromQL Queries
# 1. Query request rate over last 5 minutes
rate(http_requests_total[5m])

# 2. Query P95 latency
histogram_quantile(0.95, rate(http_request_duration_seconds_bucket[5m]))

# 3. Query error rate
sum(rate(http_requests_total{status=~"5.."}[5m]))
/
sum(rate(http_requests_total[5m]))

# 4. Group by service
sum by (service) (rate(http_requests_total[5m]))
3.2 Loki: Lightweight Log Aggregation
Core Function
Loki is Grafana Labs’ open-source log aggregation system, specialized in storing and querying logs. Its design is inspired by Prometheus, using labels to index logs.
Differences from ELK
| Aspect | Loki | ELK (Elasticsearch) |
|---|---|---|
| Storage | Indexes labels only, not log content | Full-text indexing |
| Resource Usage | Low (only 10-20% of ELK) | High |
| Query Language | LogQL (similar to PromQL) | Lucene |
| Use Cases | Cloud-native, Kubernetes | Complex log analysis |
Why choose Loki?
- ✅ Deep integration with Prometheus and Grafana
- ✅ Low resource consumption, suitable for small-to-medium deployments
- ✅ Simple operation, gentle learning curve
- ✅ Multi-tenant isolation support
How It Works
┌─────────────────┐
│   Application   │ Outputs JSON format logs to stdout
└────────┬────────┘
         │
         ▼ Collection (Docker log driver / Promtail)
┌─────────────────┐
│      Loki       │ Indexes labels, stores logs
└────────┬────────┘
         │
         ▼ LogQL query
┌─────────────────┐
│     Grafana     │ Visualization
└─────────────────┘
LogQL Query Examples
# 1. Query ERROR logs for specific service
{service="device-service", level="ERROR"}

# 2. Query logs containing specific keyword
{service="gateway-service"} |= "timeout"

# 3. Query all logs for specific tenant
{tenantId="tenant-001"}

# 4. Count ERROR logs in last 5 minutes
count_over_time({level="ERROR"}[5m])

# 5. Query logs by Trace ID
{service="data-service"} |= "trace-id-12345"
3.3 Tempo: Efficient Distributed Tracing
Core Function
Tempo is Grafana Labs’ open-source distributed tracing backend, for storing and querying distributed trace data.
Comparison with Jaeger/Zipkin
| Feature | Tempo | Jaeger | Zipkin |
|---|---|---|---|
| Storage Cost | Very low (only indexes Trace ID) | Medium | Medium |
| Scalability | High (relies on object storage) | Medium | Medium |
| Integration | Deeply integrated with Grafana LGTM | Standalone | Standalone |
| Protocol Support | OTLP, Jaeger, Zipkin | Jaeger | Zipkin |
Why choose Tempo?
- ✅ Extremely low storage cost (only indexes Trace ID)
- ✅ Deep integration with Prometheus and Loki
- ✅ Supports multiple protocols (OTLP, Jaeger, Zipkin)
- ✅ Suitable for cloud-native environments
How It Works
Request enters Gateway Service
         ↓
    Generate Trace ID (e.g., abc123)
         ↓
    Call Device Service (propagate Trace ID)
         ↓
    Device Service calls database (create Span)
         ↓
    All Spans sent to Tempo
         ↓
    Grafana queries and displays complete trace
Trace Structure Example
Trace (Trace ID: abc123)
├── Span 1: HTTP GET /api/devices (Gateway Service) - 150ms
│   ├── Span 2: Database Query (Device Service) - 50ms
│   └── Span 3: Redis Cache (Device Service) - 10ms
└── Span 4: Kafka Publish (Device Service) - 20ms
Key concepts:
- Trace ID: Unique identifier for entire request chain
- Span ID: Unique identifier for single operation
- Parent Span ID: Parent Span’s ID (for building call tree)
- Duration: Operation time spent
TraceQL Query Examples
# 1. Query traces for specific service
{service="gateway-service"}

# 2. Query traces with duration > 1 second
{duration > 1s}

# 3. Query traces containing errors
{status=error}

# 4. Query by Trace ID
{traceId="abc123def456"}
3.4 Grafana: Unified Visualization Platform
Core Function
Grafana is an open-source data visualization and monitoring platform. It doesn’t store data itself but reads from various data sources for display.
Main Features
- Multi-datasource support: Supports 30+ data sources including Prometheus, Loki, Tempo, InfluxDB, Elasticsearch
- Rich visualizations: Charts, dashboards, tables, heatmaps, and more
- Alert management: Metric-based alert rule configuration and notification
- Dashboard sharing: Import/export dashboard configurations, share with team
Role in LGTM
Grafana is the unified entry point for the entire stack. Users through Grafana:
- View Prometheus metric data
- Query Loki logs
- Analyze Tempo traces
- Configure alert rules
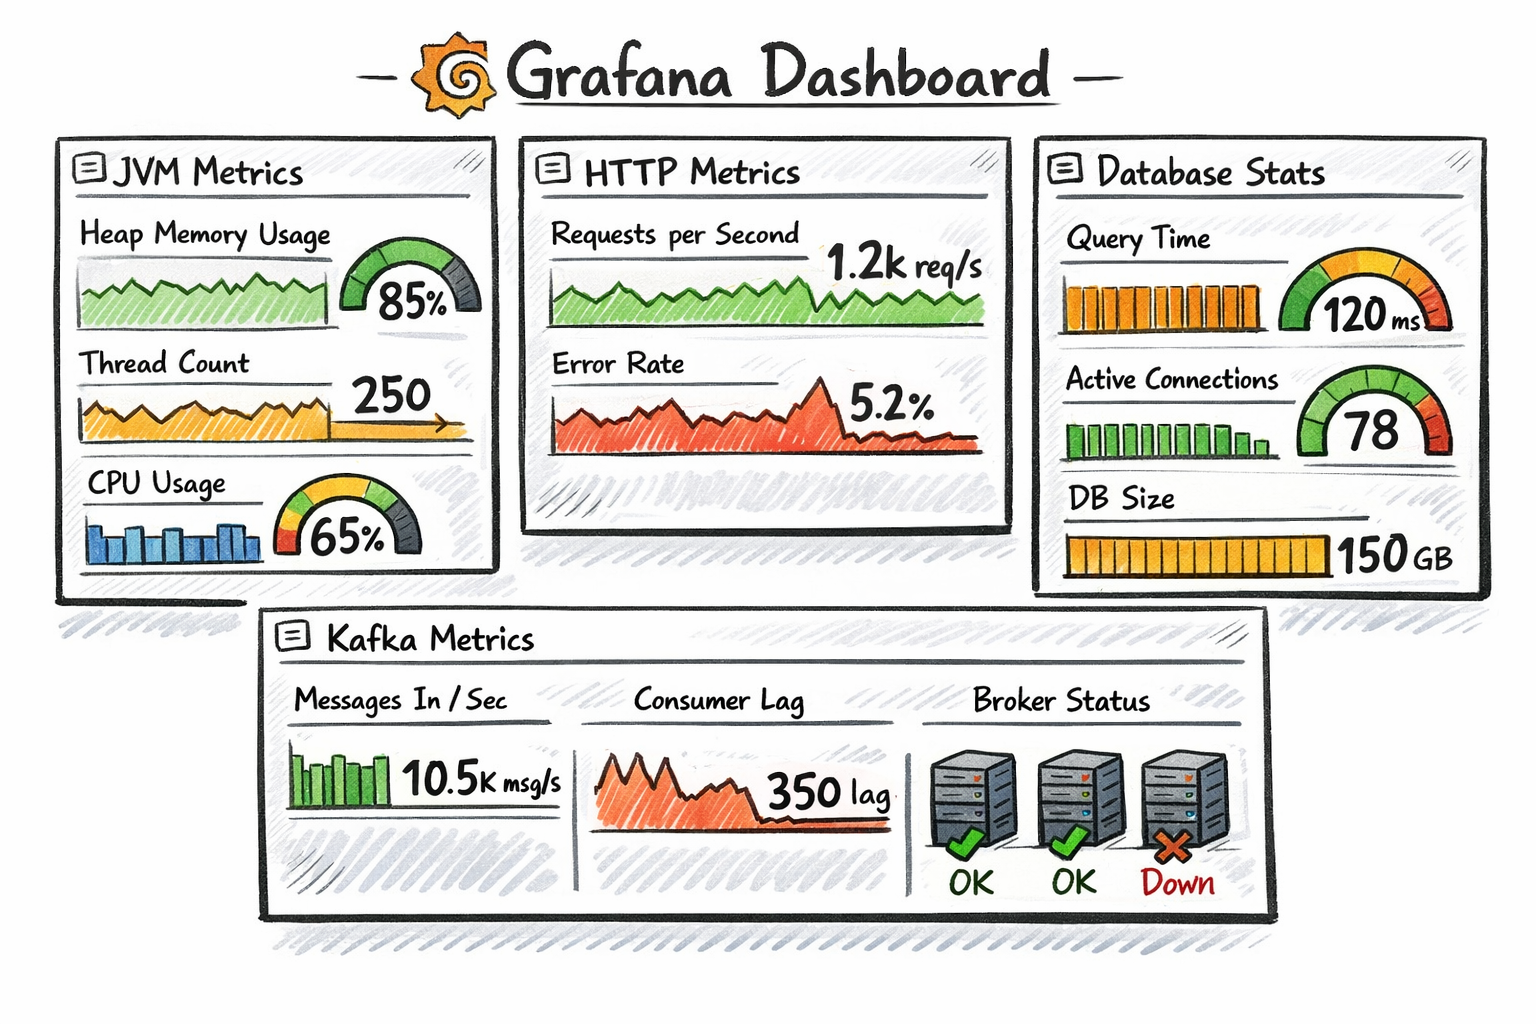
Dashboard Organization Recommendations
📁 Project Name
├── 📊 Service Overview (all service health, request volume, error rate)
├── 📊 JVM Details (memory, GC, threads)
├── 📊 Database Monitoring (connection pool, slow queries)
├── 📊 Kafka Monitoring (consumer lag, throughput)
└── 📊 Business Metrics (device online count, message volume)
IV. Component Collaboration and Data Flow
4.1 Collaboration of Three Pillars
┌─────────────────────────────────────────────────────┐
│                  User Request Entry                  │
└────────────┬────────────────────────────────────────┘
             │
             ▼
┌────────────────────────────────────────────────────┐
│              Gateway Service                        │
│  • Generate Trace ID: abc123                       │
│  • Record HTTP request metrics (Metrics)           │
│  • Output access logs (Logs)                       │
└────────────┬───────────────────────────────────────┘
             │
             ▼
┌────────────────────────────────────────────────────┐
│              Device Service                         │
│  • Propagate Trace ID: abc123                      │
│  • Record database query metrics (Metrics)         │
│  • Output business logs (Logs)                     │
│  • Create Span (Database Query - 50ms)             │
└────────────┬───────────────────────────────────────┘
             │
             ▼
┌────────────────────────────────────────────────────┐
│           Data Collection and Storage Layer          │
│  • Prometheus: Collects metric data                 │
│  • Loki: Collects log data                         │
│  • Tempo: Collects trace data                      │
└────────────┬───────────────────────────────────────┘
             │
             ▼
┌────────────────────────────────────────────────────┐
│              Grafana Unified Visualization           │
│  • Display metric dashboards (Metrics)             │
│  • Query and display logs (Logs)                   │
│  • Analyze distributed traces (Traces)             │
│  • Configure alert rules                           │
└────────────────────────────────────────────────────┘
4.2 Real-World Application Scenarios
Scenario 1: Rapid Service Failure Localization
Problem: User reports “device list loading is slow”
Troubleshooting steps:
- Check Grafana dashboard → Discover Gateway Service P95 latency spiked to 5 seconds
- Click latency chart → Jump to Tempo trace → View slow request’s trace
- Analyze trace → Discover 80% time spent on Device Service database query
- Click Span → Jump to Loki logs → Find database connection pool wait alert
- Root cause: Database connection pool too small (max 10 connections), exhausted
Solution: Adjust connection pool config maximum-pool-size: 20
Scenario 2: Cross-Service Call Chain Analysis
Problem: Device data upload fails, but unknown which link failed
Troubleshooting steps:
- Query error logs in Loki:
{service="data-service", level="ERROR"} |= "device-data" - Extract Trace ID from logs:
traceId: xyz789 - Query trace in Tempo → See complete call chain:
Gateway (10ms) → Device Service (20ms) → Kafka (5ms) → Data Service (150ms) └── Database Insert (140ms) - Failed - Click Database Span → View error message:
Duplicate key violation - Root cause: Device repeatedly uploaded same data, primary key conflict
Solution: Add idempotency check to business logic
V. OpenTelemetry: Unified Collection Standard
5.1 What is OpenTelemetry?
OpenTelemetry is a CNCF top-level project with the goal of unifying collection standards for the three pillars of observability (Metrics, Logs, Traces).
5.2 Core Components
- OTLP (OpenTelemetry Protocol): Unified transport protocol
- SDK: Multi-language support (Java, Go, Python, Node.js, etc.)
- Collector: Data collection and forwarding
5.3 Why Emphasize OpenTelemetry?
- Avoid vendor lock-in: Standardized collection layer, replaceable backends (Prometheus, Jaeger, Tempo)
- Cross-language unification: Java, Go, Python use same protocol and standards
- LGTM compatible: Prometheus supports OTLP, Tempo natively supports OTLP
- Future trend: Already top 3 in CNCF activity ranking in 2026
5.4 Relationship Between OpenTelemetry and LGTM
┌────────────────────────────────────────────────────┐
│              Application Layer                      │
│  • OpenTelemetry SDK (Java/Go/Python)             │
│  • Unified collection of Metrics, Logs, Traces     │
└────────────┬───────────────────────────────────────┘
             │
             ▼ OTLP protocol
┌────────────────────────────────────────────────────┐
│          OpenTelemetry Collector                    │
│  • Data receive, process, forward                  │
└────────────┬───────────────────────────────────────┘
             │
             ├─→ Prometheus (Metrics)
             ├─→ Loki (Logs)
             └─→ Tempo (Traces)
VI. Comparison of Other Mainstream Monitoring Solutions
| Solution | Advantages | Disadvantages | Use Cases |
|---|---|---|---|
| LGTM Stack | Open-source, cloud-native, low resource usage | Relatively simple features | Small-to-medium enterprises, cloud-native projects |
| SkyWalking | Integrated APM, powerful topology analysis | Higher resource consumption | Large enterprises, heavy APM needs |
| ELK Stack | Powerful log analysis, mature ecosystem | High cost, complex maintenance | Log-focused, complex query needs |
| Datadog | Comprehensive features, ready-to-use | Commercial, high cost | Fast deployment, sufficient budget |
| Zipkin/Jaeger | Mature tracing features | Need to combine with other components | Tracing-specific scenarios |
How to choose?
- ✅ Cloud-native projects: Prioritize LGTM Stack
- ✅ Heavy APM needs: Consider SkyWalking
- ✅ Fast deployment: Commercial solution Datadog
- ✅ Limited budget: Open-source LGTM Stack
VII. What Level Should Developers Master?
7.1 Basic Skills (Essential for All Developers)
Metrics:
- ✅ Understand Prometheus basic concepts (metric types, labels, time series)
- ✅ Able to read and understand Grafana dashboards
- ✅ Able to write simple PromQL queries (e.g., query request rate, error rate)
- ✅ Understand role of metrics in troubleshooting
Logs:
- ✅ Understand importance of structured logging
- ✅ Able to query Loki logs in Grafana
- ✅ Understand role of Trace ID in logs
- ✅ Able to quickly locate problems through logs
Traces:
- ✅ Understand basic concepts of Trace ID, Span ID
- ✅ Able to view traces in Grafana
- ✅ Understand role of tracing in performance analysis
- ✅ Able to locate slow calls through traces
7.2 Applied Skills (Needed for Daily Development)
Metrics:
- 🔥 Able to add metric instrumentation (using Micrometer, Prometheus Client, etc.)
- 🔥 Able to design reasonable business metrics (QPS, latency, error rate)
- 🔥 Able to write complex PromQL queries (aggregation, grouping, filtering)
- 🔥 Able to design simple Grafana dashboards
Logs:
- 🔥 Able to configure structured log output (JSON format)
- 🔥 Able to add Trace ID, tenant ID and other labels to logs
- 🔥 Able to write LogQL queries (filtering, regex matching, statistics)
- 🔥 Able to perform log data masking
Traces:
- 🔥 Able to integrate OpenTelemetry SDK
- 🔥 Able to customize Span attributes (e.g., tenant ID, device ID)
- 🔥 Able to analyze traces and locate performance bottlenecks
- 🔥 Able to understand Trace ID propagation mechanism
Alert Configuration:
- 🔥 Able to configure basic alert rules (service down, high error rate)
- 🔥 Understand alert levels (Critical, Warning, Info)
- 🔥 Able to avoid alert storms
7.3 Architecture Skills (Technical Experts/Architects)
Architecture Design:
- 🚀 Able to design multi-cluster, multi-datacenter monitoring architecture
- 🚀 Able to evaluate and select monitoring solutions (LGTM vs SkyWalking vs Datadog)
- 🚀 Able to plan data retention policies, sampling strategies, storage cost optimization
High Availability Design:
- 🚀 Prometheus high availability (federation, Thanos)
- 🚀 Loki horizontal scaling (read-write separation, object storage)
- 🚀 Tempo distributed deployment
Platform Capabilities:
- 🚀 Build unified observability platform
- 🚀 Implement “one-click onboarding”: automatic service registration to monitoring system
- 🚀 Multi-tenant isolation, cost allocation
VIII. Learning Path Recommendations
8.1 Phase 1: Understand Concepts (1-2 weeks)
-
Learn observability basics
- Understand three pillars: Metrics, Logs, Traces
- Learn about Prometheus, Loki, Tempo, Grafana roles
-
Deploy LGTM Stack
- Quick deployment using Docker Compose
- Access each component’s Web UI
-
Learn basic queries
- PromQL basic queries (rate, sum, avg)
- LogQL basic queries (label filtering, keyword search)
- TraceQL basic queries (by service, by Trace ID)
8.2 Phase 2: Hands-On Practice (2-4 weeks)
-
Add monitoring to applications
- Integrate Spring Boot Actuator + Micrometer
- Add custom business metrics
- Configure structured logging
-
Design Grafana dashboards
- Create service overview dashboard
- Create JVM monitoring dashboard
- Create business metrics dashboard
-
Configure alert rules
- Service down alerts
- Error rate alerts
- Latency alerts
8.3 Phase 3: Deep Understanding (4+ weeks)
-
Distributed tracing integration
- Integrate OpenTelemetry SDK
- Customize Span attributes
- Analyze traces to locate performance bottlenecks
-
Performance optimization
- Quickly locate root causes through metrics, logs, and traces
- Optimize slow queries and slow calls
-
Architecture design
- Learn monitoring system high-availability architecture
- Evaluate pros and cons of different monitoring solutions
IX. Frequently Asked Questions (FAQ)
Q1: What’s the difference between LGTM Stack and ELK Stack?
| Aspect | LGTM Stack | ELK Stack |
|---|---|---|
| Core Capability | Metrics + Logs + Traces | Primarily Logs |
| Resource Usage | Low (only 10-20% of ELK) | High |
| Deployment Complexity | Low | High |
| Query Languages | PromQL + LogQL + TraceQL (unified style) | Lucene (logs only) |
| Use Cases | Cloud-native, microservices | Log-focused analysis |
Selection recommendations:
- ✅ If you need complete observability (Metrics + Logs + Traces), choose LGTM
- ✅ If you only need powerful log analysis, choose ELK
Q2: How does Trace ID propagate between services?
Propagated through HTTP headers:
GET /api/devices HTTP/1.1
Host: gateway-service:8080
traceparent: 00-4bf92f3577b34da6a3ce929d0e0e4736-00f067aa0ba902b7-01
- Spring Boot automatically propagates through
Micrometer Tracing - Kafka messages carry Trace ID through headers
- All components (database, Redis) automatically associate with same Trace
Q3: What should production Trace sampling rate be?
Recommendations:
- Production: 10% sampling (avoid excessive storage costs)
- Testing: 100% sampling (facilitates debugging)
- Error requests: 100% sampling (must capture all errors)
Q4: How to reduce observability system costs?
- Adjust sampling rate: Reduce production trace sampling to 10%
- Shorten retention: Keep logs 7 days, traces 3 days, metrics 15 days
- Use object storage: Store Loki and Tempo data in S3/MinIO
- Aggregate metrics: Only keep key metrics, reduce fine-grained metric storage through pre-aggregation
X. Summary and Outlook
10.1 Key Points Recap
1. Observability is essential in cloud-native era
- Traditional monitoring cannot handle distributed system complexity
- Three pillars (Metrics, Logs, Traces) are indispensable
2. LGTM Stack is the current optimal solution
- Open-source, cloud-native, low resource consumption
- Deep integration with Spring Boot, Kubernetes
3. Developer capability levels
- Basic: Understand concepts, able to query and analyze
- Applied: Able to instrument, configure, design dashboards
- Architecture: Able to design monitoring architecture, evaluate solutions
4. Clear learning path
- From understanding concepts → hands-on practice → deep understanding
- Progressive, practice-driven
10.2 Future Trends
Trend 1: OpenTelemetry becomes unified standard
- Already top 3 in CNCF activity ranking in 2026
- Major companies migrating from proprietary solutions to OpenTelemetry
Trend 2: AI-assisted operations (AIOps)
- Automatically identify anomaly patterns through machine learning
- Intelligent alert aggregation, reduce alert noise
- Automated root cause analysis
Trend 3: Edge computing monitoring
- Growing demand for IoT device and edge node monitoring
- Lightweight agents, edge data pre-processing
Trend 4: Observability platformization
- Unified observability platform (Metrics + Logs + Traces + Events)
- Multi-tenant isolation, cost allocation, self-service onboarding
10.3 Next Steps
For beginners:
- Deploy LGTM Stack immediately (Docker Compose one-click startup)
- Add metric instrumentation and structured logging to existing projects
- Create first dashboard in Grafana
For experienced developers:
- Deep dive into distributed tracing, integrate OpenTelemetry
- Optimize alert strategies, reduce alert noise
- Explore monitoring system high-availability architecture
For architects:
- Evaluate enterprise observability solutions
- Design multi-cluster, multi-datacenter monitoring architecture
- Explore frontiers like AIOps, edge computing monitoring
Further Reading
Official Documentation:
- Prometheus Official Documentation
- Grafana Official Documentation
- Loki Official Documentation
- Tempo Official Documentation
- OpenTelemetry Official Documentation
Community Resources:
In conclusion:
In the cloud-native era, observability is no longer a “nice-to-have” but a “must-have”. An excellent developer not only writes high-quality code but also makes systems “visible”, “clear”, and “understandable”.
Remember this: A system without monitoring is running naked.
I hope this article helps you build a complete observability knowledge framework and stand out in the cloud-native era!
Welcome to follow FishTech Notes for more insights